Articles

Apache Spark in Microsoft Fabric

If you have used Spark in Azure Synapse, prepare to be pleasantly surprised with the compute experience in Microsoft Fabric as Spark compute starts a lot faster because the underlying technology has changed. The Data Engineering and Data Science Fabric experiences include a managed Spark compute, which like previous Spark compute charges you when it is in use. The difference is the nodes are reserved for you, rather than allocated when you start the compute which results in compute starting in 30 seconds or less versus the 4 minutes of waiting it takes for Azure Synapse compute to start.  If you have different capacity needs that a default managed Spark compute will not provide, you can always create a custom pool.  Custom pools are created in a specific workspace, so you will need Administrator permissions on the workspace to create them. You can choose to make the new pool your default pool as well, so it will be what starts in the workspace.

Writing Spark Code in Fabric

If you are writing code in Spark, the two languages you will most likely be using are Python or Scala, but you could also chose Java, Scala, R, or ANSI SQL. Notice that unlike with Azure Synapse, .Net is not included as a language you can use, which is an interesting development. The other thing to keep in mind when writing SQL code in Spark is you will be writing ANSI SQL, not TSQL which you use in Lakehouses and SQL endpoints within Fabric. While TSQL is ANSI compliant, I realized the extent of the differences when trying to use some of the DATEPART TSQL commands as they have underscores in Spark and you use instr instead of TSQLs CHARINDEX. The differences are minor and stackoverflow or copilot can help you with the differences. Just remember that you may not be able use the exact same code as in the SQL endpoint and you will be fine.

Lakehouse Integration and Autogenerated Code

Like all Fabric experiences, the lakehouse is an integral part of the coding experience. When you create a new notebook, the first step is to add a lakehouse. Once it has been added, you can drag and drop elements inside of the notebook and fabric will write the code for you. Literally this code block shown below was created when I dragged over the table publicholidays into the notebook.

Autogenerated Spark dataframe using the clicky-draggy method

Generating code with Copilot in Spark

Fabric in Spark includes a library called chat-magics, and this library includes AI features which you can incorporate in your code if you have copilot enabled in your tenant.  There are a few administrative steps you need to include to make that work.  To enable copilot the first step is to see if it is supported in your Fabric tenant as it is not available everywhere.  Check the list to make sure it is possible. Also you will need to pay for the feature as Copilot is not available as part of the free trial and you will need a Fabric F64 SKU or a P1 capacity to use it. Once you have validated you can use Copilot, you will want to go to the Administrative settings and enable Copilot in your tenant, as shown below.

Fabric Copilot Admin settings

Once Copilot is enabled and active, you will be able to enable it by clicking on the copilot icon on the far right of the screen.  If you don’t see it, click on the ellipse, the three dot menu where Microsoft hides all the cool stuff and you will see the icon in a dropdown menu.

Chat-magics: Copilot spark help

Here are 6 Chat magic commands designed to help you with your code.

%%chat – Designed to provide answers for you regarding items in your code such as variables
%%describe – Provides a summary of the contents of a dataframe
%%code  – Explain what code you want written and copilot will generate it for you
%%add_comments – Most people forget to comment their code, and if this is you you can have AI generate meaningful comments for you.
%%fix_errors – Using this command, copilot will try to fix dependance, configuration and resource allocation errors for you.

In my next post I will provide examples of how to use chat magic commands in Fabric.

Yours Always,

Ginger Grant

Data aficionado et Data Raconteur


Fabric Features not found in Azure Synapse or Power BI – Data Activator

Fabric Admin Portal Tenant Settings for Data Activator

With the GA release of Fabric in November, 2023, I am dedicating several posts to new features which you will not find in Power BI or Azure Synapse, and the latest one I want to talk about is Data Activator. Data Activator is an interesting tool to include inside of Fabric because it is not reporting or ETL, rather it is a way to manage actions when the data hits defined targets.  It is a management system for data stored in Fabric or streamed in Azure using IOT or Event Hubs. You can use Data Activator to monitor the current state or to define actions to occur when certain conditions occur in the data.  Data Activator is still in preview, but you can evaluate it now.

Using Data Activator

Getting started in Data Activator requires you to have access to the Tenant Administration features of Fabric.  I have included an image of the Admin Portal Tenant settings so that you can see the Data Activator Option which must be enabled.  After this change has been made you will see the option for Data Activator in the icon menu in the bottom right corner.

Fabric Admin Portal Tenant Settings for Data Activator

Fabric Admin Portal Tenant Settings for Data Activator


Monitoring Data with Data Activator

Data activator is designed to process data in either real time or in batch and then do something with it. For example, let’s say that you are responsible for ensuring that a set of refrigerators are operating at tolerance for a set of retail stores. A series of IOT devices is in each refrigerator, which periodically sends the ID of the device and a temperature. If a temperature records over 40 Degrees Fahrenheit for 30 minutes, a work ticket should be created, and technician should be dispatched to solve the problem. If your data is batched, you may decide that if your KPI numbers are below thresholds you set, that someone should investigate why for example the number of yards of concrete poured yesterday was down significantly as perhaps there could be something that you could do to keep the issue from happening today. Reports will show you that these sorts of events occurred, and then the person monitoring the values in the report are supposed to take action. With Data Activator, you create triggers to initiate the action which should happen in response to the changes in data.

Triggering Action

The first step for creating actions in Data Activator is to connect to your data source then you can create a trigger. The Trigger alerts are similar to alerts you may have created on a Power BI Dashboard, where you provide a measure, time interval, then a rule and then which workspace to save the trigger in. Before you create the trigger, you need to create elements which support it. In our example where we are monitoring the freezer temperatures, we have a Unique Event Id which we are going to use to create an object, which we will call Fridge Alert. Once we create the object with the Transaction ID, we will then add properties to it of temperature and location. Lastly we will need a measure for the average temperature over 40 for 15 minutes. We will call that new measure Chill Alert. We can see how many times that has occurred over the last 24 hours in the data pane. Now that we have an alert, we will create a trigger action, sending an email when it occurs. We fill out the email as shown here.

Data Activator Trigger Action Pane

We can also triggger a Power Automate action to create a dispatch event as well. Selecting the start button will start the trigger data evaluation. As you can see, Data Activator can help you easily monitor your data by completing some very simple steps.  I hope that you check out this Fabric feature as it really takes monitoring data to the next level.

Yours Always,

Ginger Grant

Data aficionado et SQL Raconteur

Fabric Features not found in Azure Synapse or Power BI – Data Wrangler

Fabric Features not found in Azure Synapse or Power BI – Data Wrangler

The second element in my series on new Fabric Features is Data Wrangler. Data Wrangler is an entirely new feature found inside of the Data Engineering and Machine Learning Experience of Fabric. It was created to help analyze data in a lakehouse using Spark and generated code. You may find that there’s a lot of data in the data lake that you need to evaluate to determine how you might incorporate the data into a data model. It’s important to examine the data to evaluate what the data contains. Is there anything missing? Incorrectly data typed? Bad Data? There is an easy method to discover what is missing with your data which uses some techniques commonly used by data scientists. Data Wrangler is used inside of notebooks in the Data Engineering or Machine Learning Environments, as the functionality does not exist within the Power BI experience.

Step-by-step Data Wrangling

The example I am going to walk through here uses the public holiday sample dataset, which you can load by clicking on the Use a sample button with Data Engineering, and selecting Public Holidays. Once you create a lakehouse with the sample data, you can follow along with the steps in this blog for doing your own data wrangling.

From within the Data Engineering Environment, select the notebook from the + New dropdown menu to create a new notebook. You will need to add some data to the lakehouse inside of the new notebook. To do this, click on the green Add button in the lakehouse section of the screen to add your Public Holiday Lakehouse. After the lakehouse is loaded, you will have two file folders, if you click on the one labelled Files, you will see two more folders. Click on the folder called sample_datasets, which makes it turn green and you will see a list of files in the sample_datasets pane which opens up. If you click on the ellipse menu next to public_holidays.parquet, you will see a popup window. In that window, select Load data and you will see two options, Spark and Pandas. The screen image shows what it looks like.

When Fabric was first released, the only option available for Data Wrangling was pandas, which is not Spark compliant. For more information regarding Pandas, check out my blog on Koalas where I cover why you don’t want to use pandas. I am very happy to see the Spark dataframes option as it is spark compliant, and can then take advantage of Spark’s superior memory and data management. However all of the generated code is pandas, and then converted to Spark. Data Wrangler will use Pandas no matter which option you select. We are now going to need to run this code which was generated for us so the data is loaded in a Spark DataFrame, by going to the Run menu and selecting Run all. This will start up the Spark cluster and run the code. You can look in the bottom left corner to see when it is complete.

Once you see the data you can start wrangling it. Go the Data tab and select Transform DataFrame in DataWrangler, then select the dataframe which was created for you, df.

Using Data Wrangler


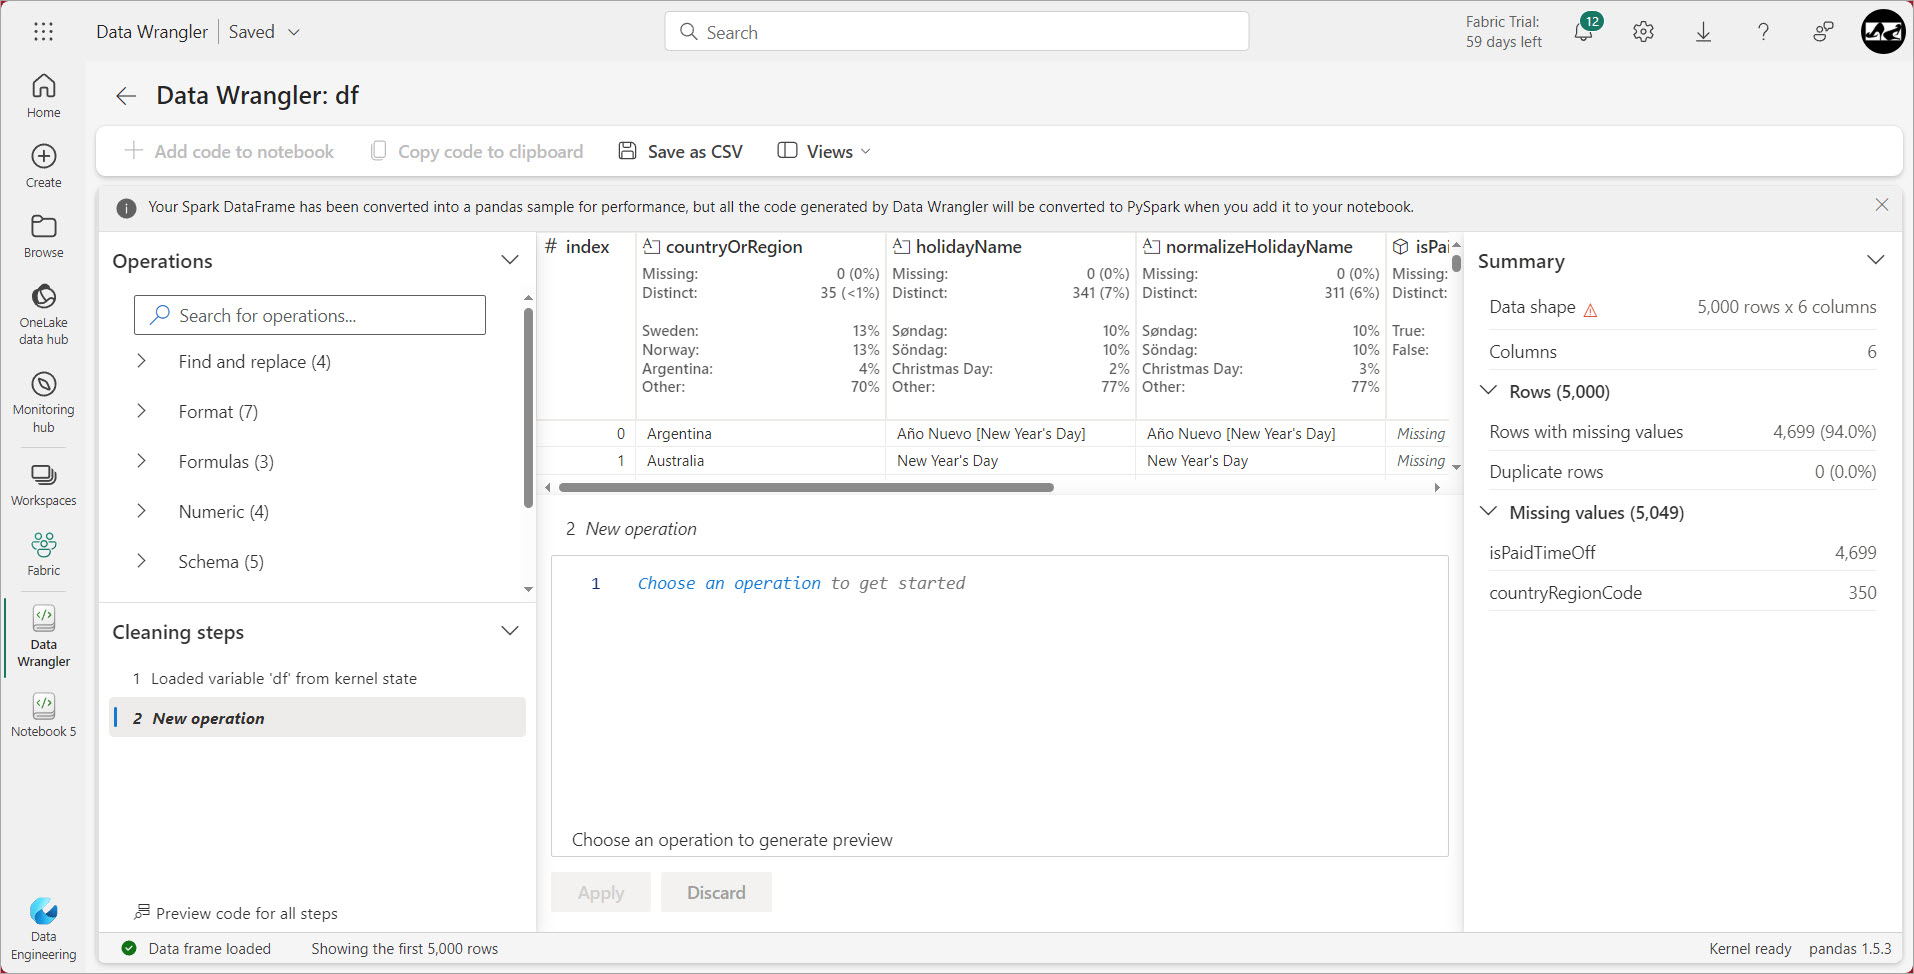
In the Data Wrangler screen which is pictured here, you will see several interesting items. The first is at the top of the screen, where it lets you know that this code is pandas, but the code will be converted to pySpark when you leave Data Wrangler, but everything here will be pandas. This is important as if you end up with code you want to use, you can just use the generated code because it will be spark compliant. The top of the screen looks a lot like something you might see within Power Query if you have all the view items checked. Data Wrangler also shows missing and distinct as well as the top 3 values. On the left side of the screen there is a list of tasks which will generate code for you. I am going to select the first two of them, starting with Drop Duplicate Rows, which you can see in the screen shot image. This will immediately generate a line of code to drop the rows across all columns, but nothing will happen until the Apply button is clicked, which I will do so the code will be run. The applied steps are called cleaning steps and they appear on the bottom left side of the screen. Even if a step is applied it is not removed from the list, which seems odd. I am going to select the next option which is to delete missing values, and I am then prompted with a dropdown box to select which columns I want to drop if missing. I am going to pick all, then apply the change. At this point, since I completed the first two items, I don’t have anything missing as I deleted everything, so the next two steps will do nothing , as there is nothing missing. Clicking the option preview code for all steps allows me to see the generated code.
 If I want to run this code every time I get this dataset, I want to add it to a notebook, so I will select add code to notebook. Now in my notebook, I want to add pySpark code, which is different than the pandas code generated. Optionally I can add Pandas code, but I see no reason to do that. A popup window will appear showing me the code, at which point I can just click on the add button. The generated code is added to my notebook, saving me the tedium of having to write common code like this.

Data Wrangler is another automated tool which will write code for me similar to what I might expect if I was using Co-pilot. Data Wrangler contains decision making options and is generated based on my thoughts around which would be the best option in a given scenario. I can always return to Data Wrangler to add other steps or make different selections from the operations I chose. This tool can be really useful and I plan on using it to clean up my data in Notebooks.


Yours Always

Ginger Grant

Data aficionado et SQL Raconteur

Four Different ways to incorporate Azure Synapse and Power BI

More and more I am working with Azure Synapse analytics as the location of data for Power BI, and there are 4 different ways that you can incorporate Power BI.

Incorporating Power BI inside of Synapse

The first is to connect Power BI to Azure Synapse to explore and visualize data. You can examine your datasets that you have loaded in your datalake with Power BI to help with the analysis of the data either for a data science solution or to determine how you are going to transform the data. For more information on how to do this, check out my previous blog .

Traditional Data Warehousing Sourced in Power BI

Once you have curated the data within Azure Synapse and it is ready for reporting, Power BI can do that too. Of course if you have large data and a dedicated SQL pool in Azure Synapse where your data warehouse is located you can use Power BI to visualize that large data. Given the fact that this solution is for data greater than a terabyte, you may also want to create some aggregated views in Azure Synapse to aggregate the larger data set.

Data lakehouse connection to Power BI

More and more I see companies wondering if they need a database. Some really don’t because their data sets are not that large, and what they want is a data source for Power BI. There are two different was of accomplishing this. Configure Power BI to connect to a Data Lake Gen2 to use data curated in Azure Synapse Companies are using Azure Synapse to create data lakes with data designed for reporting. See how you can connect Power BI to an Azure Data Lake Gen2 account which contains this data.

Serverless Database data source in Power BI

For my clients, what I recommend is to create a data lakehouse by curating a finite data set for Power BI reporting with a series of files in a curated folder. I will then create a Serverless data base in Azure Synapse and use that to connect to Power BI. What is great about that is if they need to run some kind of an adhoc query they can do that as well, providing a lower cost solution than was previously available.

If you are interested in hearing me talk about this topic, you might be interested in the recorded talk I gave to the DFW Power BI User group.

Regards,

Yours Always

Ginger Grant

Data aficionado et SQL Raconteur